Mastering Algorithmic Volatility Trading: Unleashing Profit Potential with Automated Strategies
Welcome to our comprehensive guide on algorithmic volatility trading. In today’s fast-paced financial markets, volatility presents both opportunities and challenges for traders. Algorithmic volatility trading, also known as automated volatility trading, combines sophisticated algorithms with real-time data analysis to identify and capitalize on market fluctuations. In this blog post, we will explore the fundamentals of algorithmic volatility trading, its benefits, strategies, and considerations for successful implementation.
Table of Contents
- What is Algorithmic Volatility Trading?
- Why is selling volatility both profitable and very risky?
- What have I tried?
- My volatility algorithm
- What do the returns look like
- Conclusion
What is Algorithmic Volatility Trading?
Algorithmic volatility trading refers to the use of automated trading strategies that leverage mathematical models and algorithms to capture profits from price fluctuations in volatile markets. By rapidly analyzing vast amounts of data and executing trades based on predefined rules, algorithmic volatility trading aims to exploit short-term market inefficiencies and generate consistent returns.
The VIX, also known as the Volatility Index, is a measure of expected volatility in the stock market over the next 30 days, often referred to as the “fear gauge.” VIX investing acts as insurance by providing protection against market downturns and increased volatility. It can be used as a hedging tool to offset losses in a portfolio during periods of market stress. By including VIX investments, investors can potentially diversify their portfolio and mitigate the negative impact of financial crises or systemic shocks.
In my case, I become a seller of insurance against market volatility. The key factors influencing the success of such a strategy are that it be both rules-based and systematic. Selling volatility provides several structural benefits: capital has a cost, hedging is risky and expensive, and downside exposure is hard to
quantify. In addition, the constant demand for insurance, when combined with these structural elements, results in option prices that are often greater than their expected value. A simple way to sell volatility that is allowed in registered funds (RRSP, TFSA) is through the SVXY. SVXY is an exchange-traded fund (ETF) that aims to provide inverse exposure to the S&P 500 VIX Short-Term Futures Index, allowing investors to potentially profit from declining volatility in the VIX futures market.
Why is selling volatility both profitable and very risky?
When selling insurance, the premise to being profitable involves offsetting the costs of claims. The same applies to selling volatility. Let’s take UVXY as an example. UVXY is an ETF that tracks the daily returns of the one-month blend of first and second month VIX futures – with leverage factor 1.5x. On a logarithmic scale, the graph below shows consistent declining returns for the UVXY ETF over time.
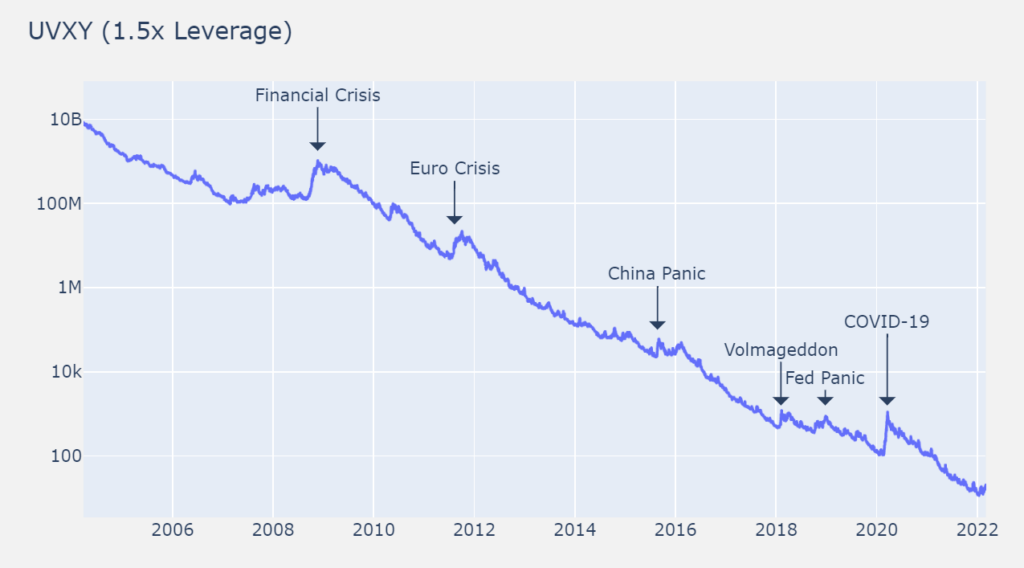
The main reason VIX ETFs tend to decrease over time is due to a market phenomenon known as contango. Contango occurs when the futures contracts on the VIX have higher prices than the expected future spot price of the index. As a result of contango, when VIX ETFs roll their futures contracts, they sell the expiring (shorter-term) contracts and purchase longer-term contracts. Since the longer-term contracts are more expensive, this process leads to a loss known as “negative roll yield” or “roll decay.” Over time, these losses can cause the value of VIX ETFs to decline, even if the VIX itself remains relatively stable.
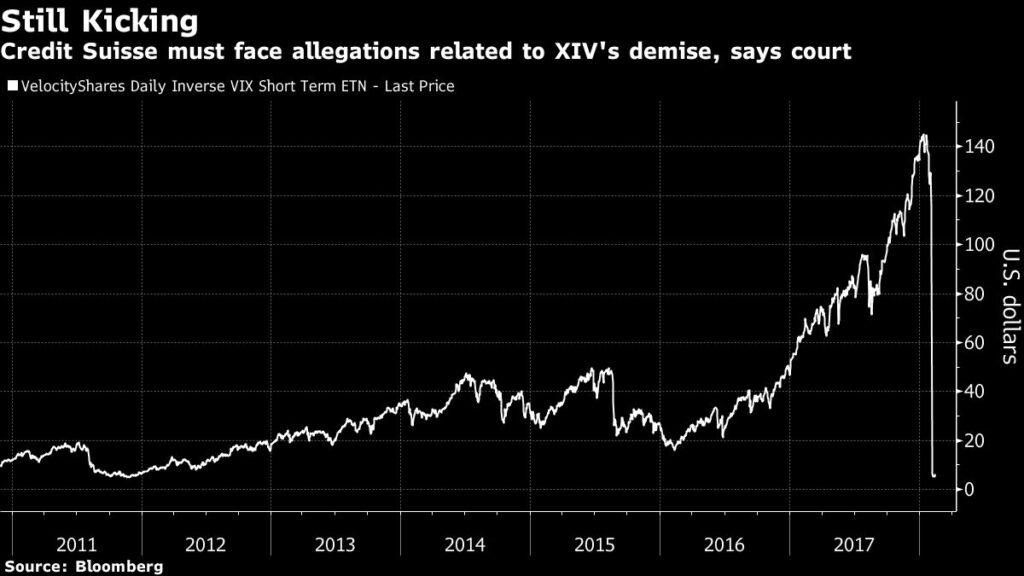
Why not simply short the UVXY (or buy SVXY) for profit? Let’s take a look at one of the spikes, Volmageddon. Back in the 2010s, XIV was the most liquid means of shorting VIX. “Volmageddon,” the February 2018 spike in volatility that wiped out short volatility strategies, illustrates the dangers of hedge and leverage rebalancing in highly concentrated and volatile markets. Assuming your strategy were shorting VIX using XIV, you would have lost that position in a single day with no recovery (XIV fund stopped trading after this).
What have I tried?
In an attempt to predict downturns (the equivalent of an insurance claim), I looked into various strategies and indicators. Most notably, I still enjoy following Brent Osachoff and his excellent explanations about volatility trading. I have replicated a total of 16 indicators he uses to attempt to predict the returns of the SVXY. Without going into the details of the indicators, I will show you the correlation matrix. The correlation matrix basically shows the explaining power of each feature with respect to the return of the SVXY.
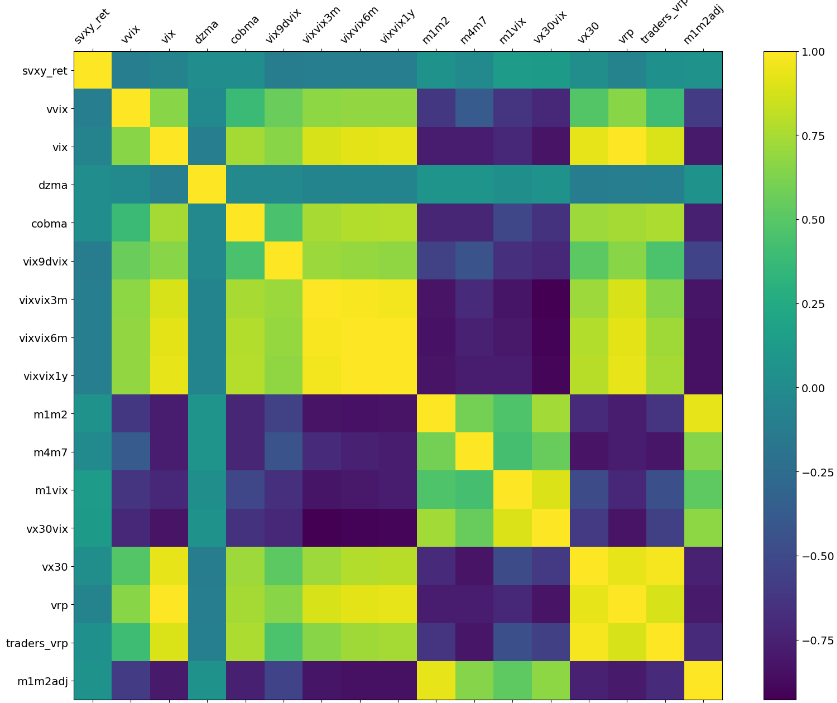
Looking at the correlation matrix above, we are interested in any feature that can help explain SVXY returns (svxy_ret). As we look at that specific column (or row, it’s the same), we notice that all the features are quite close to zero as indicated by their turquoise colour. In other words, this means that their relationship to SVXY returns is very weak.
Working from the hypothesis that I can explain SVXY returns, I attempted countless permutations and variations. I added features, performed PCA to reduce the features, and even tried numerous ML algorithms. Compared to buy and hold returns, ML model returns seldom exceeded this benchmark.
My volatility algorithm
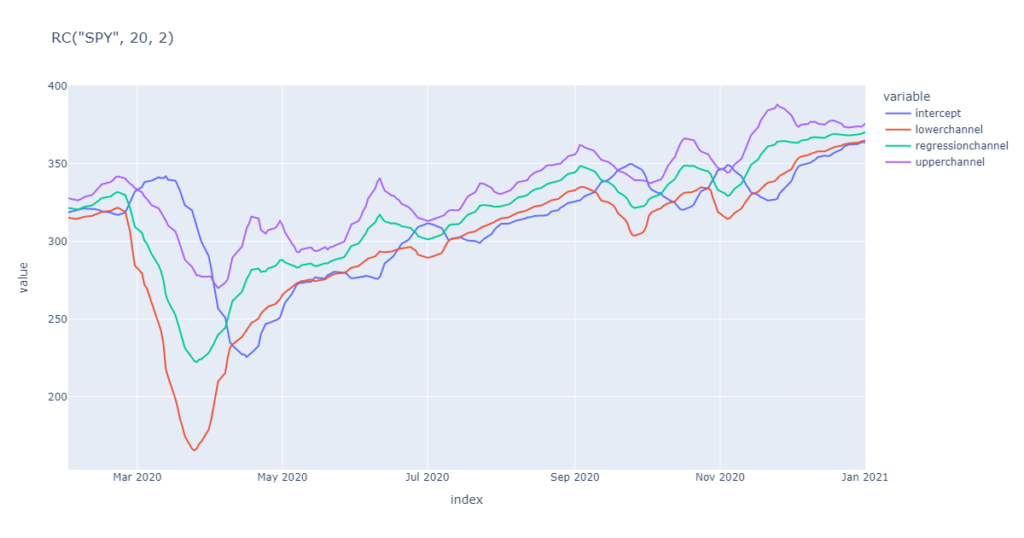
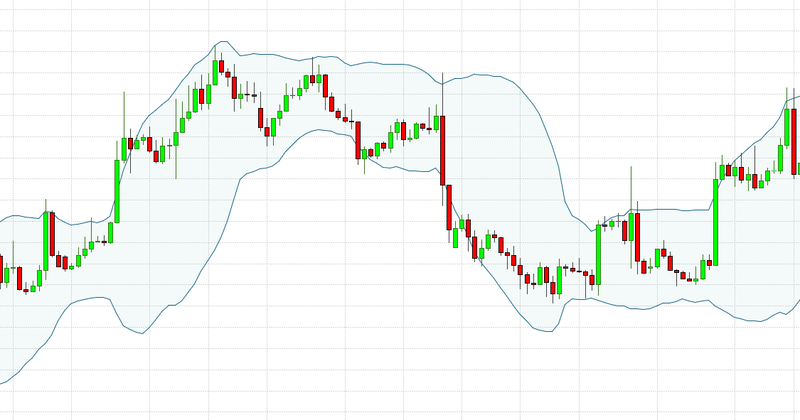
Given my limited success with ML algorithms, I’ve opted to go for a much simpler approach. I combine bollinger bands (BB), simple moving average (SMA), and regression channel (RC). First, I trigger a buy signal if the upper channel in the RC is above the VIX. If the trigger is set, I send a buy signal if the SMA is also above the VIX. Finally, I send a sell signal when the BB lower band is higher than the VIX.
What do the returns look like
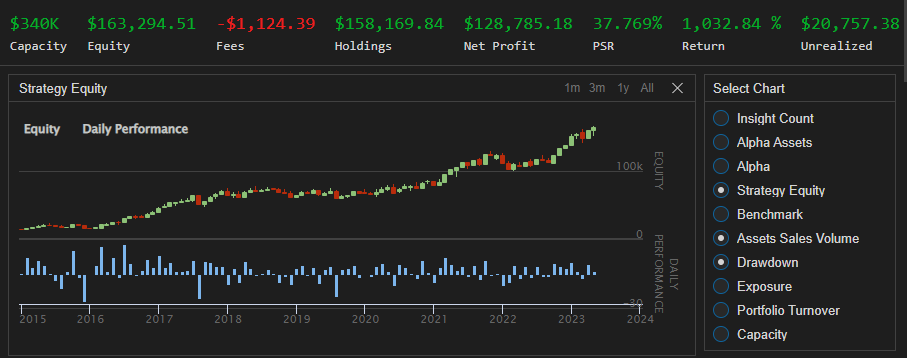
The results of my VIX strategy backtest are quite promising. They show a 1,000% return over a period of about 8 years (that’s 33% compounding annual returns). What’s more interesting is that the strategy navigates Volmageddon and covid-19 periods quite well in my opinion.
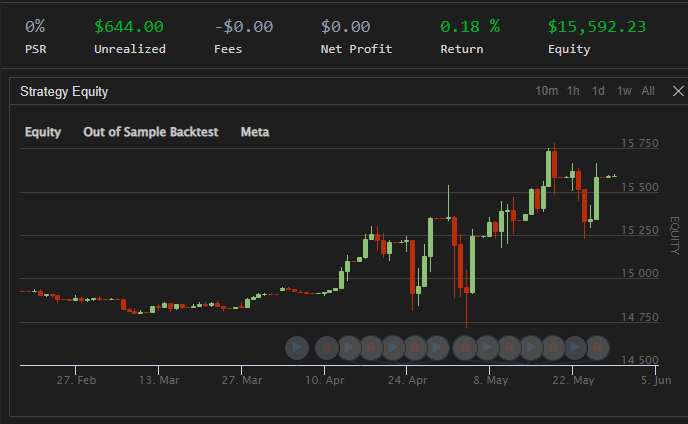
How about in production? Well, so far so good. I have been running this algorithm for about 4 months. The first two months did not trade, so there are only currency fluctuations. The last two months returns are due to holding the SVXY. There haven’t been any volatility events to test my strategy yet and it is generating an excellent return. To be honest, the hardest part is resisting the urge to lock in some profits manually. The whole point of running algorithmic trading is to trust in my strategy and my backtests. By the way, this strategy is highly volatile and not recommend as a general approach to trading. Only trust the smallest part of your portfolio to this strategy and be willing to lose it all.
Conclusion
Algorithmic volatility trading provides traders with a powerful tool to navigate the complexities of volatile markets. By leveraging advanced algorithms, real-time data analysis, and robust risk management, traders can potentially capitalize on short-term market fluctuations and achieve consistent profitability. However, it is crucial to understand the intricacies of algorithmic trading, adapt strategies to market conditions, and prioritize risk management for long-term success in this dynamic field. Stay updated with industry trends and continually refine your trading systems to unlock the full potential of algorithmic volatility trading.
Remember, this blog post is for informational purposes only and should not be considered as financial advice. Always conduct thorough research and consult with professionals before making any investment decisions.
